Wednesday, March 10, 2010

Mars Dunes: On the Move?

Movement of ripples on dark sand dunes in the Nili Patera region of MarsNew studies of ripples and dunes shaped by the winds on Mars testify to variability on that planet, identifying at least one place where ripples are actively migrating and another where the ripples have been stationary for 100,000 years or more.

Patterns of dunes and the smaller ripples present some of the more visually striking landforms photographed by cameras orbiting Mars. Investigations of whether they are moving go back more than a decade.

Two reports presented at the 41st Lunar and Planetary Sciences Conference near Houston this week make it clear that the answer depends on where you look. Both reports used images from the High Resolution Imaging Science Experiment (HiRISE) camera on NASA's Mars Reconnaissance Orbiter, which allows examination of features as small as about a meter, or yard, across.

One report is by Simone Silvestro of the International Research School of Planetary Sciences at Italy's G. d'Annunzio University, and his collaborators. They investigated migration of ripples and other features on dark dunes within the Nili Patera area of Mars' northern hemisphere. They compared an image taken on Oct. 13, 2007, with another of the same dunes taken on June 30, 2007. Most of the dunes in the study area are hundreds of meters long. Ripples form patterns on the surfaces of the dunes, with crests of roughly parallel ripples spaced a few meters apart.

Careful comparison of the images revealed places where ripples on the surface of the dunes had migrated about 2 meters (7 feet) -- the largest movement ever measured in a ripple or dune on Mars. The researchers also saw changes in the shape of dune edges and in streaks on the downwind faces of dunes.

Monday, March 08, 2010

Antarctic Collision Forms Rhode Island-Sized Berg

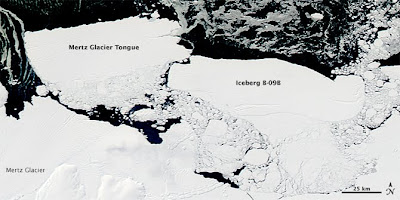
Iceberg - itself nearly the size of Rhode Island -- collided with an Antarctic glacier last month, forming a new berg still larger than the European nation of Luxembourg.

At 58 miles by 24 miles in size, the B-09B iceberg (1,392 square miles) is comparable to the state of Rhode Island (1,545 square miles), which is wider but not quite so long. After lingering near the Mertz Glacier in Eastern Antarctica for several years, the massive B-09B collided with the glacier tongue on February 12 or 13, breaking it away from the rest of the glacier. The former glacier tongue formed a new iceberg nearly as large as B-09B.

The iceberg formed from the Mertz Glacier Tongue is 48 miles long and 24 miles wide (1,152 square miles) and has a mass of 700 to 800 billion tons, reported BBC News. The images below, all from the Moderate Resolution Imaging Spectroradiometer (MODIS) sensor on NASA’s Aqua satellite, show the iceberg and glacier tongue before and after the collision.

Antarctic Iceberg Collision
The top image is from Feb. 7, 2010, when B-09B was approaching the Mertz Glacier Tongue. Chunks of sea ice float in the water between the smooth iceberg and the coast. It is clear that the iceberg and the glacier tongue are trapping the ice in place. The water beyond the tongue and the iceberg is black in these images, and contains far less ice. The ice tongue itself is an extension of the Mertz Glacier, created as the ice flows down the mountain and onto the water. Glacier tongues grow longer year by year until they eventually break off, calving a new iceberg. The Mertz Glacier Tongue was beginning to break before the B-09B iceberg rammed it. Dark horizontal cracks were visible in the ice tongue on February 7.

Antarctic Iceberg Collision
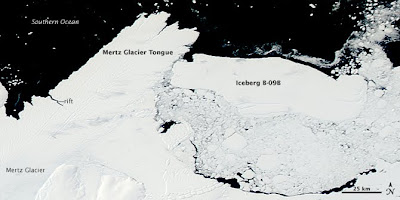
Sometime on February 12 or 13, B-09B struck the ice tongue. Clouds hid the event in MODIS satellite images, but on the afternoon of February 13, the clouds had thinned just enough to reveal that the ice tongue had broken away in the collision. The next cloud-free view of the region on February 20 shows the two icebergs. The glacier tongue had clearly broken along the rifts that were visible in early February.

Antarctic Iceberg Collision

Over the course of the next week, the former Mertz Glacier Tongue pivoted away from the glacier like a door hinged at the point where B-09B hit it (lower image).

The glacier tongue had previously contributed to keeping a section of the ocean free of ice, a condition known as a polynya. The polynya provided a significant feeding site for wildlife like penguins. The shorter tongue may not protect the area from sea ice, reducing or even eliminating the polynya and the access to food it provided.

The B9 iceberg broke from the Ross Ice Shelf in West Antarctica some time in 1987. It took the massive iceberg more than two decades to drift slowly out of the Ross Sea and along the coast to the Mertz Glacier in East Antarctica. Along the way, it broke apart, one segment becoming the massive B-09B iceberg that collided with the glacier tongue in February 2010.

Sunday, March 07, 2010

Is That Saturn's Moon Titan or Utah?

Sikun Labyrinthus on Saturn's moon Titan
Planetary scientists have been puzzling for years over the honeycomb patterns and flat valleys with squiggly edges evident in radar images of Saturn's moon Titan. Now, working with a "volunteer researcher" who has put his own spin on data from NASA's Cassini spacecraft, they have found some recognizable analogies to a type of spectacular terrain on Earth known as karst topography. A poster session today, Thursday, March 4, at the Lunar and Planetary Science Conference in The Woodlands, Texas, displays their work.

Karst terrain on Earth occurs when water dissolves layers of bedrock, leaving dramatic rock outcroppings and sinkholes. Comparing images of White Canyon in Utah, the Darai Hills of Papua New Guinea, and Guangxi Province in China to an area of connected valleys and ridges on Titan known as Sikun Labyrinthus yields eerie similarities. The materials may be different - liquid methane and ethane on Titan instead of water, and probably some slurry of organic molecules on Titan instead of rock - but the processes are likely quite similar.

"Even though Titan is an alien world with much lower temperatures, we keep learning how many similarities there are to Earth," said Karl Mitchell, a Cassini radar team associate at NASA's Jet Propulsion Laboratory in Pasadena, Calif. "The karst-like landscape suggests there is a lot happening right now under the surface that we can't see."

Indeed, Mitchell said, if the karst landscape on Titan is consistent with Earth's, there could very well be caves under the Titan surface.

Work on these analogies was spearheaded by Mike Malaska of Chapel Hill, N.C., an organic chemist by trade and a contributor in his spare time to unmannedspaceflight.com, a Web site for amateur space enthusiasts to try their hand at visualizing NASA data. Malaska approached radar team member Jani Radebaugh at Brigham Young University in Provo, Utah, about collaborative work after meeting her at last year's Lunar and Planetary Science Conference.

"I've been in love with Titan since Cassini beamed down the first images of Titan's Shangri-La sand sea," Malaska said. "It's been amazing for the public to see data come down so quickly and get data sets so rich that you can practically imagine riding along with the spacecraft."

Radebaugh steered Malaska toward a swath of landscape imaged by the radar instrument on Dec. 20, 2007. Malaska traced out patterns in the landscape on his computer and classified them into different types of valley patterns. He saw that some of the valleys had no apparent outlets and wondered where the fluid and material went.

Sunday, February 28, 2010

NASA Unveils New Space-Weather Science Tool

When NASA’s satellite operators need accurate, real-time space-weather information, they turn to the Community Coordinated Modeling Center (CCMC) of the Space Weather Laboratory at NASA's Goddard Space Flight Center in Greenbelt, Md. The CCMC’s newest and most advanced space-weather science tool is the Integrated Space Weather Analysis (iSWA) system.

The iSWA is a robust, integrated system provides information about space weather conditions past, present, and future and, unlike many other programs currently in use, has an interface that the user can customize to suit a unique set of data requirements.

Animation illustrating an artist's concept of Coronal Mass Ejection (CME) cannibalism

"The iSWA space-weather data analysis system offers a unique level of customization and flexibility to maintain, modify, and add new tools and data products as they become available," says Marlo Maddox, iSWA system chief developer at NASA Goddard.

iSWA draws together information about conditions from the sun to the boundary of the sun’s influence, known as the heliosphere. The iSWA systems digests information from spacecraft including the National Oceanic and Atmospheric Administration’s (NOAA) Geostationary Operational Environmental Satellites (GOES), NASA’s Solar Terrestrial Relations Observatory (STEREO), the joint European Space Agency and NASA mission Solar and Heliospheric Observatory (SOHO), and NASA's Advanced Composition Explorer (ACE).

Citizen scientists and science enthusiasts can also use the data, models, and tools of the iSWA system. Similar to the way in which armchair astronomers have used SOHO data to discover comets, enthusiasts will find the iSWA system a wonderful resource for increasing their familiarity with the concept of space weather.

Monday, February 22, 2010

3D Sun for the iPhone

Imagine holding the entire sun in the palm of your hand. Now you can. A new iPhone app developed by NASA-supported programmers delivers a live global view of the sun directly to your cell phone. Users can fly around the star, zoom in on active regions, and monitor solar activity.
"This is more than cool," says Dick Fisher, director of NASA's Heliophysics Division in Washington DC. "It's transformative. For the first time ever, we can monitor the sun as a living, breathing 3-dimensional sphere."

The name of the app is "3D Sun" and it may be downloaded free of charge at Apple's app store. Just enter "3D Sun" in the Store's search box or visit http://3dsun.org for a direct link.

Realtime images used to construct the 3-dimensional sphere are beamed to Earth by the Solar-Terrestrial Relations Observatory (STEREO), a pair of spacecraft with a combined view of 87% of the solar surface. STEREO-A is stationed over the western side of the sun, while STEREO-B is stationed over the east. Together, they rarely miss a thing.

Screen capture of 3D Sun on the iPhone

Telescopes onboard the two spacecraft monitor the sun in the extreme ultraviolet (EUV) portion of the electromagnetic spectrum. "That's why the 3D sun looks false-color green," explains Lika Guhathakurta, STEREO program scientist at NASA Headquarters. "These are not white-light images."

That's okay because EUV is where the action is. Solar flares and new sunspots shine brightly at these wavelengths. EUV images also reveal "coronal holes," vast dark openings in the sun's atmosphere that spew streams of solar wind into the solar system. Solar wind streams that hit Earth can spark intense displays of Northern Lights.

"With this app, you can spin the sun, zoom in on sunspots, inspect coronal holes--and when a solar flare erupts, your phone plays a little jingle to alert you!" says Guhathakurta.

Tuesday, February 16, 2010

Cassini Set to Do Retinal Scan of Saturnian Eyeball

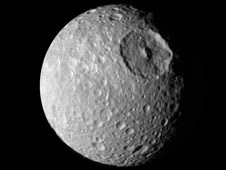
Saturn Moon MimarOn Feb. 13, 2010, NASA's Cassini spacecraft will make its closest examination yet of Mimas, an eyeball-shaped moon of Saturn that has also been likened to the Death Star of "Star Wars." The spacecraft will be returning the highest-resolution images yet of this battered satellite.
Mimas bears the mark of a violent, giant impact from the past - the 140-kilometer-wide (88-mile-wide) Herschel Crater - and scientists hope the encounter will help them explain why the moon was not blown to smithereens when the impact happened. They will also be trying to count smaller dings inside the basin of Herschel Crater so they can better estimate its age.

In addition, Cassini's composite infrared spectrometer will be working to determine the thermal signature of the moon, and other instruments will be making measurements to learn more about the surface composition.

The Mimas flyby involves a significant amount of skill because the spacecraft will be passing through a dusty region to get there. Mission managers have planned for the Cassini spacecraft to lead with its high-gain antenna to provide a barrier of protection. At closest approach, the spacecraft will be flying about 9,500 kilometers (5,900 miles) above the moon. Cassini will start taking images and measurements shortly after closest approach.

Friday, January 29, 2010

Now a Stationary Research Platform, NASA's Mars Rover Spirit Starts a New Chapter in Red Planet Scientific Studies

view from the front hazard-avoidance camera on NASA's Mars Exploration
After six years of unprecedented exploration of the Red Planet, NASA's Mars Exploration Rover Spirit no longer will be a fully mobile robot. NASA has designated the once-roving scientific explorer a stationary science platform after efforts during the past several months to free it from a sand trap have been unsuccessful.

The venerable robot's primary task in the next few weeks will be to position itself to combat the severe Martian winter. If Spirit survives, it will continue conducting significant new science from its final location. The rover's mission could continue for several months to years.

"Spirit is not dead; it has just entered another phase of its long life," said Doug McCuistion, director of the Mars Exploration Program at NASA Headquarters in Washington. "We told the world last year that attempts to set the beloved robot free may not be successful. It looks like Spirit's current location on Mars will be its final resting place."

Ten months ago, as Spirit was driving south beside the western edge of a low plateau called Home Plate, its wheels broke through a crusty surface and churned into soft sand hidden underneath.

After Spirit became embedded, the rover team crafted plans for trying to get the six-wheeled vehicle free using its five functioning wheels – the sixth wheel quit working in 2006, limiting Spirit's mobility. The planning included experiments with a test rover in a sandbox at NASA's Jet Propulsion Laboratory in Pasadena, Calif., plus analysis, modeling and reviews. In November, another wheel quit working, making a difficult situation even worse.

Recent drives have yielded the best results since Spirit became embedded. However, the coming winter mandates a change in strategy. It is mid-autumn at the solar-powered robot's home on Mars. Winter will begin in May. Solar energy is declining and expected to become insufficient to power further driving by mid-February. The rover team plans to use those remaining potential drives for improving the rover's tilt. Spirit currently tilts slightly toward the south. The winter sun stays in the northern sky, so decreasing the southward tilt would boost the amount of sunshine on the rover's solar panels.

Monday, January 25, 2010

2009: Second Warmest Year on Record; End of Warmest Decade

10yrs avg global temperature index
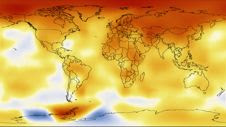
2009 was tied for the second warmest year in the modern record, a new NASA analysis of global surface temperature shows. The analysis, conducted by the Goddard Institute for Space Studies (GISS) in New York City, also shows that in the Southern Hemisphere, 2009 was the warmest year since modern records began in 1880.

Although 2008 was the coolest year of the decade -- due to strong cooling of the tropical Pacific Ocean -- 2009 saw a return to near-record global temperatures. The past year was only a fraction of a degree cooler than 2005, the warmest year on record, and tied with a cluster of other years -- 1998, 2002, 2003, 2006 and 2007 -- as the second warmest year since recordkeeping began.

“There’s always an interest in the annual temperature numbers and on a given year’s ranking, but usually that misses the point,” said James Hansen, the director of GISS. “There's substantial year-to-year variability of global temperature caused by the tropical El Niño-La Niña cycle. But when we average temperature over five or ten years to minimize that variability, we find that global warming is continuing unabated."

January 2000 to December 2009 was the warmest decade on record. Throughout the last three decades, the GISS surface temperature record shows an upward trend of about 0.2°C (0.36°F) per decade. Since 1880, the year that modern scientific instrumentation became available to monitor temperatures precisely, a clear warming trend is present, though there was a leveling off between the 1940s and 1970s.

Thursday, January 21, 2010

Study Links Spring Ozone Over North America With Emissions Abroad

Lidar (light detection and ranging) beams from the tropospheric ozone lidar laboratory at JPL's Table Mountain Facility near Wrightwood, Calif., provided tropospheric ozone data used in the NOAA study
Springtime ozone levels above western North America are rising, primarily due to air flowing eastward from the Pacific Ocean, a trend that is most significant when the air originates in Asia. These increases in ozone could make it more difficult for the United States to meet Clean Air Act standards for ozone pollution at ground level, according to a new international study published online Jan. 20 in the journal Nature.

The study led by the National Oceanic and Atmospheric Administration (NOAA) analyzed large quantities of ozone data captured since 1984. Among the data sources for the study were profiles of ozone in Earth's troposphere (lowermost atmosphere) measured since 1999 by the differential absorption lidar (laser detection and ranging) system located at the NASA Jet Propulsion Laboratory Table Mountain Facility near Wrightwood, Calif. That remote, high-altitude facility enables research in atmospheric science, optical communication and astronomy. Measurements from atmospheric balloons launched from Table Mountain also contributed to the findings.

"In springtime, pollution from across the hemisphere, not nearby sources, contributes to the ozone increases above western North America," said lead author Owen R. Cooper of the NOAA-funded Cooperative Institute for Research in Environmental Sciences at the University of Colorado at Boulder. "When air is transported from a broad region of south and east Asia, the trend is largest."

The study focused on springtime ozone in a slice of the atmosphere from 3 to 8 kilometers (2 to 5 miles) above the surface of western North America, far below the protective ozone layer but above ozone-related, ground-level smog that is harmful to human health and crops. Ozone in this intermediate region constitutes the northern hemisphere background, or baseline level, of ozone in the lower atmosphere. The study was the first to pull together and then analyze the nearly 100,000 ozone observations gathered in separate studies by instruments on aircraft, balloons and other platforms.

Combustion of fossil fuels releases pollutants like nitrogen oxides and volatile organic compounds, which react in the presence of sunlight to form ozone. North American emissions contribute to global ozone levels, but the researchers did not find any evidence that these local emissions are driving the increasing trend in ozone above western North America.

Sunday, January 17, 2010

Port-Au-Prince, Haiti in January 2010

Haiti Image
NASA’s Earth Observing-1 satellite with the Advanced Land Imager (ALI) instrument aboard took an image centered on Port-au-Prince, Haiti on Friday, January 15, 2010, three days after the earthquake. The picture on the left is the entire ALI image. The lower right image is a zoom-in of Port-au-Prince, while the upper right image is the same view taken in September 2008, one week after Hurricane Ike. Significant features can be seen in both zoom images. Hurricane Ike unleashed torrential rains that caused severe flooding as depicted (upper right image) in the excessive discharge of sediment at the river delta, just north of downtown Port-au-Prince. The pier in the center of the 2008 image collapsed during the earthquake and is not visible in the 2010 image (lower right image).

Wednesday, January 13, 2010

Asteroid To Fly By Earth Wednesday Is a Natural

Asteroid 2010 AL30, discovered by the LINEAR survey of MIT's Lincoln Laboratories on Jan. 10, will make a close approach to the Earth's surface to within 76,000 miles on Jan. 13 at 12:46 pm Greenwich time (7:46 am EST, 4:46 am PST). Because its orbital period is nearly identical to the Earth's one year period, some have suggested it may be a manmade rocket stage in orbit about the sun. However, this object's orbit reaches the orbit of Venus at its closest point to the sun and nearly out to the orbit of Mars at its furthest point, crossing the Earth's orbit at a very steep angle. This makes it very unlikely that 2010 AL30 is a rocket stage. Furthermore, trajectory extrapolations show that this object cannot be associated with any recent launch and it has not made any close approaches to the Earth since well before the Space Age began.

It seems more likely that this is a near-Earth asteroid about 10-15 meters in size, one of approximately 2 million such objects in near-Earth space. One would expect a near-Earth asteroid of this size to pass within the moon's distance about once every week on average. The asteroid does not pose a risk, in fact, stony asteroids under 25 meters in diameter would be expected to burn up in our atmosphere, causing little or no ground damage.

Tuesday, January 12, 2010

Cassini Returns to Southern Hemisphere of Titan

Artist's concept of Cassini's Jan. 12, 2010NASA'S Cassini spacecraft will return to Titan's southern hemisphere on a flyby tomorrow, Jan. 12, plunging to within about 1,050 kilometers (about 670 miles) of the hazy moon's surface. During this pass, the onboard radar instrument will scan Ontario Lacus, the largest lake in the southern hemisphere, in a quest to learn more about the liquid methane and ethane in the lake and obtain more detailed topographical information about the shoreline. Titan is the only other body in the solar system besides Earth that is known to have stable liquid on its surface.

This will also be the most southern pass in the mission for the ion and neutral mass spectrometer instrument, which will probe the composition and density of the atmosphere near Titan's south pole. The atmospheric data collected on this pass will be paired with a similar sampling mission near Titan's north pole during the most recent flyby, 16 days earlier.

Cassini last flew by Titan on Dec. 27, 2009 California time, or Dec. 28 Universal Time. Although this latest flyby is dubbed "T65," planning changes early in the orbital tour have made this the 66th targeted flyby of Titan. This flyby also comes two days before the fifth anniversary of the landing of the Huygens probe on the surface of Titan.

The Cassini-Huygens mission is a cooperative project of NASA, the European Space Agency and the Italian Space Agency. JPL, a division of the California Institute of Technology in Pasadena, manages the Cassini mission for NASA's Science Mission Directorate, Washington, D.C. JPL designed, developed and assembled the Cassini orbiter. The Huygens probe, built and managed by the European Space Agency, was bolted to Cassini and rode along during its nearly seven-year journey to Saturn, before being released for its descent through Titan's atmosphere.

Monday, January 11, 2010

NASA Supports the President's Educate To Innovate Campaign With Summer Of Innovation To Bring Students The Universe

NASA has launched an initiative to use its out-of-this-world missions and technology programs to boost summer learning, particularly for underrepresented students across the nation. NASA's Summer of Innovation supports President Obama's Educate to Innovate campaign for excellence in science, technology, engineering and mathematics, or STEM, education.

The Summer of Innovation program will work with thousands of middle school teachers and students during multi-week programs in the summer of 2010 to engage students in stimulating math and science-based education programs. NASA's goal is to increase the number of future scientists, mathematicians, and engineers, with an emphasis on broadening participation of low-income, minority students.

"This is an incredible opportunity for our administration to come together to address our nation's critical science, technology, engineering and math education needs," said NASA Administrator and former astronaut Charles F. Bolden. "Through Summer of Innovation, NASA is calling on our financial and human resources to align with federal, state, and local governments, nonprofit partners, universities and teachers to expand the opportunity for more of our young people to aspire to and engage in the future prosperity of our nation."

Thursday, January 07, 2010

JPL Mourns Passing of Former Director Lew Allen Jr

JPL Director, AllenA former director of NASA's Jet Propulsion Laboratory, Lew Allen Jr., passed away Monday night, Jan. 4, at the age of 84, in Potomac Falls, Va. He led the laboratory from 1982 till 1990, during a period that included the launches of the Galileo mission to Jupiter, Magellan to Venus and the Infrared Astronomical Satellite, as well as Voyager 2's Uranus and Neptune flybys.

Allen was born Dec. 30, 1925, in Miami. He studied at the United States Military Academy at West Point, N.Y., and had a distinguished career in the U.S. Army and the Air Force, where he remained until 1982, achieving the rank of four-star general and serving as Chief of Staff of the Air Force.

In 1954, while still an Air Force officer assigned to the Los Alamos National Laboratory in New Mexico, Allen completed his doctorate in nuclear physics. He specialized in the potentially damaging effects of high-altitude nuclear explosions on the ground and on spacecraft.

After leaving Los Alamos in 1961, Allen served in various scientific posts within the Office of the Secretary of Defense and the Office of the Secretary of the Air Force. Allen became director of the National Security Agency in 1973. Allen was also a member of the National Academy of Engineering and the Council on Foreign Relations.

Wednesday, January 06, 2010

Sun Glints Seen from Space Signal Oceans and Lakes

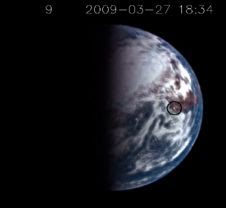
A sun glint on Earth is captured (center of the black circle)In two new videos from NASA’s Deep Impact spacecraft, bright flashes of light known as sun glints act as beacons signaling large bodies of water on Earth. These observations give scientists a way to pick out planets beyond our solar system (extrasolar planets) that are likely to have expanses of liquid, and so stand a better chance of having life.
These sun glints are like sunshine glancing off the hood of a car. We can see them reflecting off a smooth surface when we are positioned in just the right way with respect to the sun and the smooth surface. On a planetary scale, only liquids and ice can form a surface smooth enough to produce the effect—land masses are too rough—and the surface must be very large. To stand out against a background of other radiation from a planet, the reflected light must be very bright. We won’t necessarily see glints from every distant planet that has liquids or ice.

“But these sun glints are important because, if we saw an extrasolar planet which had glints that popped up periodically, we would know that we were seeing lakes, oceans or other large bodies of liquid, such as water,” says Drake Deming, of NASA’s Goddard Space Flight Center in Greenbelt, Md. Deming is the deputy principal investigator who leads the team that works on the Extrasolar Planet Observations and Characterization (EPOCh) part of Deep Impact’s extended mission, called EPOXI. “And if we found large bodies of water on a distant planet, we would become much more optimistic about finding life.”

One of EPOCh’s goals is to observe the Earth from far away—in this case, about 11 million miles away—so that we know what an Earth-like planet would look like when viewed from our spacecraft. The images in these videos were collected when the spacecraft was close enough to resolve some of Earth’s features, but at the same time, Earth could be treated as a very distant, single point. “This allows us to properly simulate what we would have observed if Earth were an extrasolar planet,” says Michael A’Hearn, principal investigator for EPOXI.

The researchers expected to see the sun glints but were surprised by the intensity and small focus of some, says Goddard’s Richard K. Barry. Glints appeared over oceans, most likely in relatively calm patches, and over a few land masses, probably caused by large inland lakes. Barry, who is leading the Earth-glint research effort, is putting together a catalog that will relate each glint to an exact location on Earth.

Together, the new videos provide the first view of Earth for a full rotation from the north pole (shown in one video) and south pole (the second video). The resolution is high enough to distinguish land masses, bodies of water and clouds. Each 16-second video is a compilation of a series of green, blue and near-infrared images taken every 15 minutes on a single day. Each is also the end product of months of planning, sophisticated data processing and analysis by the team.

Tuesday, January 05, 2010

Massive Black Hole Implicated in Stellar Destruction

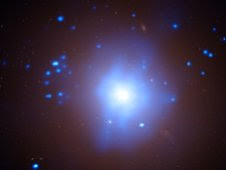
New results from NASA's Chandra X-ray Observatory and the Magellan telescopes suggest that a dense stellar remnant has been ripped apart by a black hole a thousand times as massive as the Sun. If confirmed, this discovery would be a cosmic double play: it would be strong evidence for an intermediate mass black hole, which has been a hotly debated topic, and would mark the first time such a black hole has been caught tearing a star apart.

Composite image of a so-called ultraluminous X-ray source, or ULX
This scenario is based on Chandra observations, which revealed an unusually luminous source of X-rays in a dense cluster of old stars, and optical observations that showed a peculiar mix of elements associated with the X-ray emission. Taken together, a case can be made that the X-ray emission is produced by debris from a disrupted white dwarf star that is heated as it falls towards a massive black hole. The optical emission comes from debris further out that is illuminated by these X-rays.

The intensity of the X-ray emission places the source in the "ultraluminous X-ray source" or ULX category, meaning that it is more luminous than any known stellar X-ray source, but less luminous than the bright X-ray sources (active galactic nuclei) associated with supermassive black holes in the nuclei of galaxies. The nature of ULXs is a mystery, but one suggestion is that some ULXs are black holes with masses between about a hundred and several thousand times that of the Sun, a range intermediate between stellar-mass black holes and supermassive black holes located in the nuclei of galaxies.

Monday, January 04, 2010

NASA Image of Saturn Featured in Time Magazine's 'Year in Pictures'

A stunning view of Saturn from NASA's Cassini spacecraft has made Time Magazine's 2009 "Year in Pictures."

The photo, released in September and dubbed "The Rite of Spring," was the first up close view from a spacecraft from Earth of Saturn's equinox, when the sun's disk is directly overhead at Saturn's equator. That sun angle illuminates the gas giant's famous rings edge-on, opening up a new perspective.

Saturn image in Time magazine

As Cassini imaging team leader Carolyn Porco tells Time, "The geometry revealed structures and phenomena in the rings we had never seen before. We saw this famous adornment spring from two dimensions into three, with some ring structures soaring as high as the Rocky Mountains. It made me feel blessed."

The spectacle occurs twice during each orbit Saturn makes around the sun, which takes approximately 10,759 Earth days, or about 29.7 Earth years. Earth experiences a similar equinox phenomenon twice a year; the autumnal equinox will occur Sept. 22, when the sun will shine directly over Earth's equator.

For about a week, scientists used the Cassini orbiter to look at puffy parts of Saturn's rings caught in white glare from the low-angle lighting. Scientists have known about vertical clumps sticking out of the rings in a handful of places, but they could not directly measure the height and breadth of the undulations and ridges until Saturn's equinox revealed their shadows.

Wednesday, December 30, 2009

NASA Chooses Three Finalists for Future Space Science Mission to Venus, an Asteroid or the Moon

From top to bottom, pictured (not to scale) are the moon, Venus, and an asteroid.
NASA has selected three proposals as candidates for the agency's next space venture to another celestial body in our solar system. The final project selected in mid-2011 may provide a better understanding of Earth's formation or perhaps the origin of life on our planet.

The proposed missions would probe the atmosphere and crust of Venus; return a piece of a near-Earth asteroid for analysis; or drop a robotic lander into a basin at the moon's south pole to return lunar rocks back to Earth for study.

NASA will select one proposal for full development after detailed mission concept studies are completed and reviewed. The studies begin during 2010, and the selected mission must be ready for launch no later than Dec. 30, 2018. Mission cost, excluding the launch vehicle, is limited to $650 million.

"These are projects that inspire and excite young scientists, engineers and the public," said Ed Weiler, associate administrator for the Science Mission Directorate at NASA Headquarters in Washington. "These three proposals provide the best science value among eight submitted to NASA this year."

Each proposal team initially will receive approximately $3.3 million in 2010 to conduct a 12-month mission concept study that focuses on implementation feasibility, cost, management and technical plans. Studies also will include plans for educational outreach and small business opportunities.

Monday, December 28, 2009

Cassini Spacecraft to Monitor North Pole on Titan

Artist concept of NASA's Cassini spacecraft flying by the north polar region of Saturn's moon Titan
Though there are no plans to investigate whether Saturn's moon Titan has a Santa Claus, NASA's Cassini will zoom close to Titan's north pole this weekend.

The flyby, which brings Cassini to within about 960 kilometers (600 miles) of the Titan surface at 82 degrees north latitude, will take place the evening of Dec. 27 Pacific time, or shortly after midnight Universal Time on Dec. 28.

The encounter will enable scientists to gather more detail on how the lake-dotted north polar region of Titan changes with the seasons. Scientists will be using high-resolution radar to scan the large and numerous lakes in the north polar region for shape-shifting in size and depth. The ion and neutral mass spectrometer team will take baseline measurements of the atmosphere to compare with the moon's south polar region when Cassini flies by that area on Jan. 12. Cassini will also be collecting images for a mosaic of a bright region called Adiri, where the Huygens probe landed nearly five years ago.

Cassini will have released the Huygens probe exactly five years and three days before this latest flyby. Huygens began its journey down to Titan on the evening of Dec. 24, 2004 California time, or early Dec. 25 Universal Time, and reached the surface Jan. 14, 2005.

Cassini last flew by Titan on Dec. 11, 2009 California time, or Dec. 12 Universal Time. Although this latest flyby is dubbed "T64," planning changes early in the orbital tour have made this the 65th targeted flyby of Titan.

Thursday, December 24, 2009

Cassini Holiday Movies Showcase Dance of Saturn's Moons

Like sugar plum fairies in "The Nutcracker," the moons of Saturn performed a celestial ballet before the eyes of NASA's Cassini spacecraft. New movies frame the moons' silent dance against the majestic sweep of the planet's rings and show as many as four moons gliding around one another.

Saturn Moon Ballet video still

The new video can be found at http://www.nasa.gov/cassini , http://saturn.jpl.nasa.gov and http://ciclops.org.

To celebrate the holidays, the Cassini imaging team has created a video collection of "mutual events," which occur when one moon passes in front of another, as seen from the spacecraft. Imaging scientists use mutual event observations to refine their understanding of the dynamics of Saturn's moons. Digital image processing has enabled scientists to turn these routine observations into breathtaking displays of celestial motion. The original images were captured between Aug. 27 and Nov. 8, 2009.

In one scene that synthesizes 12 images taken over the span of 19 minutes, Rhea skates in front of Janus, as Mimas and Pandora slide across the screen in the opposite direction. While the dance appears leisurely on screen, Rhea actually orbits Saturn at a speed of about 8 kilometers per second (18,000 mph). The other moons are hurtling around the planet even faster. Mimas averages about 14 kilometers per second (31,000 mph), and Janus and Pandora travel at about 16 kilometers per second (36,000 mph).

"As yet another year in Saturn orbit draws to a close, these wondrous movies of an alien place clear across the solar system remind us how fortunate we are to be engaged in this magnificent exploratory expedition," said Carolyn Porco, Cassini imaging team leader at the Space Science Institute in Boulder, Colo.

The Cassini-Huygens mission is a cooperative project of NASA, the European Space Agency and the Italian Space Agency. The Jet Propulsion Laboratory, a division of the California Institute of Technology in Pasadena, manages the mission for NASA's Science Mission Directorate in Washington. The Cassini orbiter and its two onboard cameras were designed, developed and assembled at JPL. The imaging team is based at the Space Science Institute, Boulder, Colo.

Tuesday, December 22, 2009

Keck Telescopes Gaze into Young Star's "Life Zone"

Planets form around a young star in this artist's concept. Using the Keck Interferometer in Hawaii, astronomers have probed the structure of a dust disk around MWC 419 to within 50 million miles of the star.
The inner regions of young planet-forming disks offer information about how worlds like Earth form, but not a single telescope in the world can see them. Yet, for the first time, astronomers using the W. M. Keck Observatory in Hawaii have measured the properties of a young solar system at distances closer to the star than Venus is from our sun.

"When it comes to building rocky planets like our own, the innermost part of the disk is where the action is," said team member William Danchi at NASA's Goddard Space Flight Center in Greenbelt, Md. Planets forming in a star's inner disk may orbit within its "habitable zone," where conditions could potentially support the development of life.

To achieve the feat, the team used the Keck Interferometer to combine infrared light gathered by both of the observatory's twin 10-meter telescopes, which are separated by 85 meters. The double-barreled approach gives astronomers the effective resolution of a single 85-meter telescope -- several times larger than any now planned.

"Nothing else in the world provides us with the types of measurements the Keck Interferometer does," said Wesley Traub at Caltech's Jet Propulsion Laboratory in Pasadena, Calif. "In effect, it's a zoom lens for the Keck telescopes."

In August 2008, the team -- led by Sam Ragland of Keck Observatory and including astronomers from the California Institute of Technology and the National Optical Astronomical Observatory -- observed a Young Stellar Object (YSO) known as MWC 419. The blue, B-type star has several times the sun's mass and lies about 2,100 light-years away in the constellation Cassiopeia. With an age less than ten million years, MWC 419 ranks as a stellar kindergartener.

The team also employed a new near-infrared camera designed to image wavelengths in the so-called L band from 3.5 to 4.1 micrometers. "This unique infrared capability adds a new dimension to the Keck Interferometer in probing the density and temperature of planet-forming regions around YSO disks. This wavelength region is relatively unexplored," Ragland explained. "Basically, anything we see through this camera is brand new information."

The increased ability to observe fine detail, coupled with the new camera, let the team measure temperatures in the planet-forming disk to within about 50 million miles of the star. "That's about half of Earth's distance from the sun, and well within the orbit of Venus," Danchi said.

AcrimSat Celebrates 10 Years of Measuring the Sun's Energy

Artist's concept of AcrimSat.Launched Dec. 20, 1999, the Active Cavity Radiometer Irradiance Monitor Satellite (AcrimSat) monitors the total amount of the sun's energy reaching Earth. It is this energy, called total solar irradiance, that creates the winds, heats the land and drives ocean currents. Some scientists theorize a significant fraction of Earth's warming may be solar in origin due to small increases in the sun's total energy output since the last century. By measuring incoming solar radiation, climatologists are using AcrimSat to improve their predictions of climate change and global warming over the next century.

Monday, December 21, 2009

Colliding Auroras Produce an Explosion of Light

This three frame animation of THEMIS/ASI images shows auroras collidingA network of cameras deployed around the Arctic in support of NASA's THEMIS mission has made a startling discovery about the Northern Lights. Sometimes, vast curtains of aurora borealis collide, producing spectacular outbursts of light. Movies of the phenomenon were unveiled at the Fall Meeting of the American Geophysical Union today in San Francisco.

"Our jaws dropped when we saw the movies for the first time," said space scientist Larry Lyons of the University of California-Los Angeles (UCLA), a member of the team that made the discovery. "These outbursts are telling us something very fundamental about the nature of auroras."

The collisions occur on such a vast scale that isolated observers on Earth -- with limited fields of view -- had never noticed them before. It took a network of sensitive cameras spread across thousands of miles to get the big picture.

NASA and the Canadian Space Agency created such a network for THEMIS, short for "Time History of Events and Macroscale Interactions during Substorms." THEMIS consists of five identical probes launched in 2006 to solve a long-standing mystery: Why do auroras occasionally erupt in an explosion of light called a substorm?

Twenty all-sky imagers (ASIs) were deployed across the Alaskan and Canadian Arctic to photograph auroras from below while the spacecraft sampled charged particles and electromagnetic fields from above. Together, the on-ground cameras and spacecraft would see the action from both sides and be able to piece together cause and effect-or so researchers hoped. It seems to have worked.

The breakthrough came earlier this year when UCLA researcher Toshi Nishimura assembled continent-wide movies from the individual ASI cameras. "It can be a little tricky," Nishimura said. "Each camera has its own local weather and lighting conditions, and the auroras are different distances from each camera. I've got to account for these factors for six or more cameras simultaneously to make a coherent, large-scale movie."

Friday, December 18, 2009

Quiet Sun Means Cooling of Earth's Upper Atmosphere

TIMED (Thermosphere Ionosphere Mesosphere Energetics and Dynamics) mission
New measurements from a NASA satellite show a dramatic cooling in the upper atmosphere that correlates with the declining phase of the current solar cycle. For the first time, researchers can show a timely link between the Sun and the climate of Earth’s thermosphere, the region above 100 km, an essential step in making accurate predictions of climate change in the high atmosphere.

Scientists from NASA's Langley Research Center and Hampton University in Hampton, Va., and the National Center for Atmospheric Research in Boulder, Colo., presented these results at the fall meeting of the American Geophysical Union in San Francisco from Dec. 14 to 18.

Earth's thermosphere and mesosphere have been the least explored regions of the atmosphere. The NASA Thermosphere-Ionosphere-Mesosphere Energetics and Dynamics (TIMED) mission was developed to explore the Earth’s atmosphere above 60 km altitude and was launched in December 2001. One of four instruments on the TIMED mission, the Sounding of the Atmosphere using Broadband Emission Radiometry (SABER) instrument, was specifically designed to measure the energy budget of the mesosphere and lower thermosphere. The SABER dataset now covers eight years of data and has already provided some basic insight into the heat budget of the thermosphere on a variety of timescales.

The extent of current solar minimum conditions has created a unique situation for recent SABER datasets, explains Stan Solomon, acting director of the High Altitude Observatory, National Center for Atmospheric Research in Boulder, Colo. The end of solar cycle 23 has offered an opportunity to study the radiative cooling in the thermosphere under exceptionally quiescent conditions.

Sunlight Glint Confirms Liquid in Titan Lake Zone

NASA's Cassini Spacecraft has captured the first flash of sunlight reflected off a lake on Saturn's moon Titan, confirming the presence of liquid on the part of the moon dotted with many large, lake-shaped basins.

Cassini scientists had been looking for the glint, also known as a specular reflection, since the spacecraft began orbiting Saturn in 2004. But Titan's northern hemisphere, which has more lakes than the southern hemisphere, has been veiled in winter darkness. The sun only began to directly illuminate the northern lakes recently as it approached the equinox of August 2009, the start of spring in the northern hemisphere. Titan's hazy atmosphere also blocked out reflections of sunlight in most wavelengths. This serendipitous image was captured on July 8, 2009, using Cassini's visual and infrared mapping spectrometer.

The first flash of sunlight reflected off a lake on Saturn's moon Titan

This image will be presented Friday, Dec. 18, at the fall meeting of the American Geophysical Union in San Francisco.

"This one image communicates so much about Titan -- thick atmosphere, surface lakes and an otherworldliness," said Bob Pappalardo, Cassini project scientist, based at NASA's Jet Propulsion Laboratory, Pasadena, Calif. "It's an unsettling combination of strangeness yet similarity to Earth. This picture is one of Cassini's iconic images."

Titan, Saturn's largest moon, has captivated scientists because of its many similarities to Earth. Scientists have theorized for 20 years that Titan's cold surface hosts seas or lakes of liquid hydrocarbons, making it the only other planetary body besides Earth believed to harbor liquid on its surface. While data from Cassini have not indicated any vast seas, they have revealed large lakes near Titan's north and south poles.

Wednesday, December 16, 2009

NASA Gets Up-Close Look at Far Corner of the Globe

NASA's DC-8 casts a shadow on Arctic ice during a campaign in 2008 to measure the presence of pollution from mid-latitude continents and smoke and soot from wildfires in the Arctic atmosphereThe Arctic remains in the mind a pristine wonderland. The landmasses that jut into the Arctic Circle are covered by tundra and primeval forest; the pole is covered in ice. The whole environment seems detached from human influence entirely. But the scientific record tells a different story.

A months-long airborne campaign in 2008 gave scientists a new look at how everyday human behaviors in Europe, North America and Asia are affecting the Arctic, the most rapidly changing region on Earth and a major regulator of the planet's climate. The data show human fingerprints all over the Arctic in the form of polluted exhaust from factories and smoke from fires often set by human hands. Observations from the ground have long recorded some of this impact, and satellites in low-earth orbit provide a different view, but scientists had not undertaken a detailed, airborne study of this magnitude in years.

The mission provided a new view of how pollution from industrializing Asian countries influences the Arctic. Ground sensors have long detected the regular, low-altitude movement of polluted air masses from Europe to the Arctic. Because of the colder temperatures in the countries of the pollution's origin, the plumes of carbon dioxide, carbon monoxide and other warming-related gases do not rise high in the atmosphere. On the contrary, pollution from warmer regions in Asia has apparently been moving to altitudes too high for ground instruments to observe well. The airborne instruments provided invaluable measurements of the extent of this pollution, said Daniel Jacob, a Harvard University atmospheric scientist and both mission scientist and co-principal investigator for NASA’s Arctic Composition of the Troposphere from Aircraft and Satellites (ARCTAS) mission.

"With Asian pollution, there's a relatively warm ocean immediately downwind of a fairly cold continent, so you have interesting storm tracks that lift pollution and transport it at higher altitudes," Jacob said. "It's certainly a much larger influence on Arctic haze than what had been traditionally ascribed."

Now that researchers have had some time to sift through the data collected, Jacob said the value of these observations is coming in to focus. Major airborne campaigns like this are rare, so almost any study of the Arctic atmosphere in coming years will draw on ARCTAS.

Solar Storms and Radiation Exposure on Commercial Flights

Solar storms unleash bursts of radiation that can reach crew and passengers on commercial flights at certain altitudes and latitudes.
Scientists at NASA’s Langley Research Center have completed a first attempt to accurately calculate the level of damaging radiation flight crews and passengers are exposed to on commercial airline flights. The work is an early step toward developing a model to observe radiation exposure for all commercial flights, particularly for pilots and crews who spend their careers airborne and who are at greater risk of developing certain cancers.

The study considered not only everyday radiation emanating from space, but also the additional energy unleashed during a solar storm, which can be profound. NASA scientists say not including geomagnetic effects on solar radiation in modeling radiation exposure could underestimate the dosage by 30 to 300 percent.

Researchers looked at passengers and crew on typical flights from Chicago to Beijing, Chicago to Stockholm and London to New York, during what is known as the Halloween 2003 Storm. These flights were chosen because of their long flight paths near the North Pole, where the Earth’s natural protection from radiation is weakest. Earth’s magnetic field approaches zero above the poles. The Halloween 2003 event was chosen because it was both a large and a complex storm, making it a good test for the model.

The study found that aircrew and passengers during the Chicago to Beijing flight, for example, would have been exposed to about 12 percent of the annual radiation limit recommended by the International Committee on Radiological Protection. But these exposures were greater than on typical flights at lower latitudes, and confirmed the concerns about commercial flights at high latitudes.

“The upshot is that these international flights were right there at that boundary where many of these events can take place, where radiation exposure can be much higher,” said Chris Mertens, senior research scientist at NASA’s Langley Research Center, who is leading the research effort. Mertens will present his latest results at the American Geophysical Union fall meeting in San Francisco on Dec. 16.

Tuesday, December 15, 2009

A Unique Geography -- and Soot and Dust -- Conspire Against Himalayan Glaciers

Massive rivers of ice spill off the sides of mountains and grind through creviced valleys in the Himalayas.
So many disparate elements, both natural and man-made, converge in the Himalayas," said William Lau, a climatologist from NASA’s Goddard Space Flight Center in Greenbelt, Md. "There’s no other place in the world that could produce such a powerful atmospheric heat pump," referring to a new hypothesis he’s put forward to explain the rapid retreat of Himalayan glaciers in recent decades.

The Himalayas, home to the tallest mountains on Earth, include more than 110 peaks and stretch 2,500 kilometers (1,550 miles). Bounded to the north by the Tibetan Plateau, to the west by deserts, and to the south by a bowl-like basin teeming with people, the mountains hold 10,000 glaciers.

These massive rivers of ice spill off mountain sides and grind down through creviced valleys. In the spring, when the monsoon carries moist air from the Indian Ocean, the glaciers begin to thaw, replenishing lakes, streams, and some of Asia's mightiest rivers, on which more than a billion people depend.

South of the Himalayas -- which forms the east-west edge of the table-like Tibetan Plateau -- the mountains give way to the Indo-Gangetic plain, one of the most fertile and densely populated areas on Earth. The plain has become a megalopolis of cities including Delhi, Dhaka, Kanpur, and Karachi, as well as a hotspot for air pollution, with a steady supply of industrial soot mixing with ash and other particles in the air.

Monday, December 14, 2009

Hitch A Ride On The Glory Satellite

Artist's rendition of Glory in orbit
Want to hitch a ride on NASA's next climate monitoring satellite? Join the Glory mission, which will launch no earlier than Oct. 1, by surfing over to the Send Your Name Around the Earth web page. Names will be recorded on a microchip built into the satellite, and you will get a printable certificate from NASA acknowledging your participation. There are already 225,155 names on the chip, but there's plenty more room. (You cannot submit your name more than once.)

The website is located at: http://polls.nasa.gov/utilities/sendtospace/jsp/sendName.jsp.

Glory carries two scientific sensors dedicated to understanding the effects of aerosols and the sun's variability on Earth's climate. The Aerosol Polarimetry Sensor will collect information about tiny liquid and solid particles suspended in the atmosphere that absorb or reflect sunlight. The Total Irradiance Monitor will measure the intensity of incoming sunlight which can vary over time.

Friday, December 11, 2009

Reddish Dust and Ice Migration Darken Saturn's Moon Iapetus


New views of Saturn's moon Iapetus accompany papers that detail how reddish dust swept up on the moon's orbit around Saturn and migrating ice can explain the bizarre, yin-yang-patterned surface.

The papers, led by Cassini scientists Tilmann Denk and John Spencer, appeared online in the journal Science on Dec. 10, 2009.

The new image in the left-hand panel of PIA11690 shows the most nearly complete view to date of Iapetus' charcoal-dark leading hemisphere. The right-hand panel, which had been released previously, shows the trailing hemisphere, where wide swaths are covered by bright ice. The new three-panel image PIA11689 uses false-color views in increasing levels of contrast to reveal the reddish dust that overlays the bright-dark pattern. Minimal enhancement was applied to the left panel, with increasing contrast added to the middle and right-hand images.

Monday, December 07, 2009

Geminids Meteor Shower: Nature's 'Holiday Light Show'

Star trails and a Geminids meteor over Georgia in 1985
The Geminids are one of the best meteor showers of the year and never seem to disappoint observers! Join Bill Cooke of the Meteoroid Environment Office, located at NASA's Marshall Space Flight Center, in a live web chat on Friday, December 11 from 3:00-4:00 EST to learn more about the Geminids meteor shower.

This meteor shower gets the name "Geminids" because it appears to radiate from the constellation Gemini. For the best viewing opportunity, go outside, take a blanket and something hot to drink, lay on your back and look up into the night sky. Best viewing time is between midnight and dawn on December 13-14.

An observer in the Northern hemisphere can start seeing the Geminids meteors as early as December 6, when one meteor every hour or so could be visible. During the next week, rates increase until a peak of 50-80 meteors per hour is attained on the night of December 13-14. The last Geminids are seen on December 18, when an observer might see a rate of one or so every hour.

History of the Geminids

The initial appearance of the Geminids meteor shower came fairly sudden during the 1860s. The first notation of the shower occurred in 1862 at Manchester, England. During the 1870s, observations of the Geminids became more numerous as astronomers realized a new annual shower was active.

The first estimate of the strength of Geminids came in 1877 with an hourly rate given at about 14. Rates increased slightly during the remainder of the 19th century to about 23 an hour. Reported rates continued to increase through most of the 20th century. During the 1900s, rates averaged about 20 per hour. The rates averaged near 50 per hour during the 1930s, 60 per hour during the 1940s and 1950s, 65 per hour during the 1960s and 80 per hour during the 1970s. The rates stayed near 80 per hour during the remainder of that century.

Thursday, December 03, 2009

Suzaku Spies Treasure Trove of Intergalactic Metal

The Perseus galaxy cluster
Every cook knows the ingredients for making bread: flour, water, yeast, and time. But what chemical elements are in the recipe of our universe?

Most of the ingredients are hydrogen and helium. These cosmic lightweights fill the first two spots on the famous periodic table of the elements.

Less abundant but more familiar to us are the heavier elements, meaning everything listed on the periodic table after hydrogen and helium. These building blocks, such as iron and other metals, can be found in many of the objects in our daily lives, from teddy bears to teapots.

Recently astronomers used the Suzaku orbiting X-ray observatory, operated jointly by NASA and the Japanese space agency, to discover the largest known reservoir of rare metals in the universe.

Suzaku detected the elements chromium and manganese while observing the central region of the Perseus galaxy cluster. The metallic atoms are part of the hot gas, or "intergalactic medium," that lies between galaxies.

"This is the first detection of chromium and manganese from a cluster," says Takayuki Tamura, an astrophysicist at the Japan Aerospace Exploration Agency who led the Perseus study. "Previously, these metals were detected only from stars in the Milky Way or from other galaxies. This is the first detection in intergalactic space."

The cluster gas is extremely hot, so it emits X-ray energy. Suzaku's instruments split the X-ray energy into its component wavelengths, or spectrum. The spectrum is a chemical fingerprint of the types and amounts of different elements in the gas.

Tuesday, December 01, 2009

Mars Odyssey Mission Status Report


NASA's Mars Odyssey orbiter put itself into a safe standby mode on Saturday, Nov. 28, and the team operating the spacecraft has begun implementing careful steps designed to resume Odyssey's science and relay operations within about a week.

Engineers have diagnosed the cause of the Nov. 28 event as the spacecraft's proper response to a memory error with a known source. The likely cause is an upset in the orbiter's "memory error external bus," as was the case with a similar event in June 2008.

In safe mode over the weekend, Odyssey remained in communication with ground controllers and maintained healthy temperatures and power. To clear the memory error, the team commanded Odyssey today to perform a cold reboot of the orbiter's onboard computer. The spacecraft reported that the reboot had been completed successfully.

"This event is a type we have seen before, so we have a known and tested path to resuming normal operations," said Odyssey Project Manager Philip Varghese of NASA's Jet Propulsion Laboratory, Pasadena, Calif.

Odyssey has been orbiting Mars since 2001. In addition to its own major scientific discoveries and continuing studies of the planet, the Odyssey mission has played important roles in supporting the missions of the Mars rovers Spirit and Opportunity and the Phoenix Mars Lander.

Friday, November 27, 2009

NASA Assessing New Roles for Ailing QuikScat Satellite

Artist's concept of QuikScat
NASA mission managers are assessing options for future operations of the venerable QuikScat satellite following the age-related failure of a mechanism that spins the scatterometer antenna. This spinning antenna had been providing near-real-time ocean- surface wind speed and direction data over 90 percent of the global ocean every day.

In recent months, the QuikScat project team has been monitoring a pattern of increasing friction in the bearings that allow the antenna to spin, leading to increased resistance and strain on the motor that turns QuikScat's rotating antenna. This degradation was fully expected, as the spin mechanism was designed to last about 5 years.

After experiencing further difficulties over the weekend, the antenna stopped spinning early today, Nov. 23. The QuikScat spacecraft and scatterometer instrument themselves remain in otherwise good health. Should engineers be unable to restart the antenna, QuikScat will be unable to continue its primary science mission, as the antenna spin is necessary to estimate wind speed and direction and form the wide data swath necessary to obtain nearly global sampling.

Over the coming days, NASA managers will review contingency plans for restarting the antenna and assess options for using the mission in its present degraded state to advance Earth system science in the event the antenna cannot be restarted. For example, degraded scatterometer measurements from QuikScat can still be useful for cross-calibrating the mission's climate data record with measurements from other scatterometers, including the operational EUMETSAT ASCAT instrument, India's recently launched Oceansat-2 and a planned Chinese scatterometer. Specific operational forecasting applications such as polar ice measurements and limited hurricane observations may also be supportable.

By any measure of success, the 10-year-old QuikScat mission is a unique national resource that has achieved and far surpassed its science objectives. Designed for a two-year lifetime, QuikScat has been used around the globe by the world's operational meteorological agencies to improve weather forecasts and identify the location, size and strength of hurricanes and other storms in the open ocean. The mission has also provided critical information for monitoring, modeling, forecasting and researching our atmosphere, ocean and climate.

Wednesday, November 25, 2009

Cassini Captures Ghostly Dance of Saturn's Northern Lights


In the first video showing the auroras above the northern latitudes of Saturn, Cassini has spotted the tallest known "northern lights" in the solar system, flickering in shape and brightness high above the ringed planet.

The new video reveals changes in Saturn's aurora every few minutes, in high resolution, with three dimensions. The images show a previously unseen vertical profile to the auroras, which ripple in the video like tall curtains. These curtains reach more than 1,200 kilometers (750 miles) above the edge of the planet's northern hemisphere.

The new video and still images are online at: http://www.nasa.gov/cassini , http://saturn.jpl.nasa.gov and http://ciclops.org .

Auroras occur on Earth, Jupiter, Saturn and a few other planets, and the new images will help scientists better understand how they are generated.

"The auroras have put on a dazzling show, shape-shifting rapidly and exposing curtains that we suspected were there, but hadn't seen on Saturn before," said Andrew Ingersoll of the California Institute of Technology in Pasadena, who is a member of the Cassini imaging team that processed the new video. "Seeing these things on another planet helps us understand them a little better when we see them on Earth."
Cassini Captures Ghostly Dance of Saturn's Northern Lights A Cassini scientist explains the flickering "northern lights" high above Saturn, shown for the first time in a visible-light movie.Image credit: NASA/JPL/
Play now

Auroras appear mostly in the high latitudes near a planet's magnetic poles. When charged particles from the magnetosphere -- the magnetic bubble surrounding a planet -- plunge into the planet's upper atmosphere, they cause the atmosphere to glow. The curtain shapes show the paths that these charged particles take as they flow along the lines of the magnetic field between the magnetosphere and the uppermost part of the atmosphere.

Tuesday, November 24, 2009

Mystery of the Solar Tsunami—Solved

Violent events on the Sun can trigger waves much the same as earthquakes can trigger tsunamis on the Earth
Sometimes you really can believe your eyes. That's what NASA's Solar Terrestrial Relations Observatory (STEREO) is telling researchers about a controversial phenomenon on the sun known as the "solar tsunami."

Years ago, when solar physicists first witnessed a towering wave of hot plasma racing across the sun's surface, they doubted their senses. The scale of the wave was staggering: It rose up higher than Earth itself and rippled out from a central point in a circular pattern millions of kilometers in circumference. Skeptical observers suggested it might be a shadow of some kind—a trick of the satellite's eye—but surely not a real wave.

"Now we know," says Joe Gurman of the Solar Physics Laboratory at NASA's Goddard Space Flight Center. "Solar tsunamis are real."

The twin STEREO spacecraft confirmed their reality in February 2009 when sunspot 11012 unexpectedly erupted. The blast hurled a billion-ton cloud of gas (a coronal mass ejection, or CME) into space and sent a tsunami racing along the sun's surface. STEREO recorded the wave from two positions separated by 90 degrees, giving researchers an unprecedented view of the event.

"It was definitely a wave," says Spiros Patsourakos of George Mason University, lead author of a paper reporting the finding in Astrophysical Journal Letters. "Not a wave of water, but a giant wave of hot plasma and magnetism."

Friday, November 20, 2009

The View from the Center of Our Solar System


* NASA's Cassini spacecraft is helping to rewrite our understanding of the shape of our solar system as it moves through the local Milky Way galaxy.
* Previous models pictured our solar system as having a comet-like appearance. The new results suggest a picture more like a bubble.
* Cassini scientists created an image from this exotic region of space by detecting particles known as energetic neutral atoms.
* It complements data collected by NASA's Interstellar Boundary Explorer.

When NASA's Cassini spacecraft began orbiting Saturn five years ago, a dozen highly-tuned science instruments set to work surveying, sniffing, analyzing and scrutinizing the Saturnian system.

But Cassini recently revealed new data that appeared to overturn the decades-old belief that our solar system resembled a comet in shape as it moves through the interstellar medium (the matter between stars in our corner of the Milky Way galaxy).

Instead, the new results suggest our heliosphere more closely resembles a bubble - or a rat - being eaten by a boa constrictor: as the solar system passes through the "belly" of the snake, the ribs, which mimic the local interstellar magnetic field, expand and contract as the rat passes. An animation is available here http://photojournal.jpl.nasa.gov/catalog/PIA12310.

"At first I was incredulous," said Tom Krimigis, principal investigator of the Magnetospheric Imaging Instrument (MIMI) at Johns Hopkins University's Applied Physics Laboratory in Laurel, Md. "The first thing I thought was, 'What's wrong with our data?'"

Krimigis and his colleagues on the instrument team published the Cassini findings in the Nov. 13 issue of the journal Science, which featured complementary results from NASA's Interstellar Boundary Explorer (IBEX). Together, the results create the first map of the heliosphere and its thick outer layer known as the heliosheath, where solar wind streaming out from the sun gets heated and slowed as it interacts with the interstellar medium.

Wednesday, November 18, 2009

NASA's Wise Gets Ready to Survey the Whole Sky

NASA's Wide-field Infrared Survey Explorer, or Wise, is chilled out, sporting a sunshade and getting ready to roll. NASA's newest spacecraft is scheduled to roll to the pad on Friday, Nov. 20, its last stop before launching into space to survey the entire sky in infrared light.

Wise is scheduled to launch no earlier than 6:09 a.m. PST (9:09 a.m. EST) on Dec. 9 from Vandenberg Air Force Base in California. It will circle Earth over the poles, scanning the entire sky one-and-a-half times in nine months. The mission will uncover hidden cosmic objects, including the coolest stars, dark asteroids and the most luminous galaxies.

"The eyes of Wise are a vast improvement over those of past infrared surveys," said Edward "Ned" Wright, the principal investigator for the mission at UCLA. "We will find millions of objects that have never been seen before."

The mission will map the entire sky at four infrared wavelengths with sensitivity hundreds to hundreds of thousands of times greater than its predecessors, cataloging hundreds of millions of objects. The data will serve as navigation charts for other missions, pointing them to the most interesting targets. NASA's Hubble and Spitzer Space Telescopes, the European Space Agency's Herschel Space Observatory, and NASA's upcoming Sofia and James Webb Space Telescope will follow up on Wise finds.

"This is an exciting time for space telescopes," said Jon Morse, NASA's Astrophysics Division director at NASA Headquarters in Washington. "Many of the telescopes will work together, each contributing different pieces to some of the most intriguing puzzles in our universe."

Visible light is just one slice of the universe's electromagnetic rainbow. Infrared light, which humans can't see, has longer wavelengths and is good for seeing objects that are cold, dusty or far away. In our solar system, Wise is expected to find hundreds of thousands of cool asteroids, including hundreds that pass relatively close to Earth's path. Wise's infrared measurements will provide better estimates of asteroid sizes and compositions -- important information for understanding more about potentially hazardous impacts on Earth.

"With infrared, we can find the dark asteroids other surveys have missed and learn about the whole population. Are they mostly big, small, fluffy or hard?" said Peter Eisenhardt, the Wise project scientist at NASA's Jet Propulsion Laboratory in Pasadena, Calif.

Saturday, November 14, 2009

New Moon Sets Stage for Brilliant Leonids Meteor Shower

A Leonids meteor explodes in Earth's upper atmosphere on Nov. 23, 1998.
This year's Leonids meteor shower peaks on Tuesday, Nov. 17. If forecasters are correct, the shower should produce a mild but pretty sprinkling of meteors over North America followed by a more intense outburst over Asia. The phase of the moon will be new -- setting the stage for what could be one of the best Leonid showers in years.

"We're predicting 20 to 30 meteors per hour over the Americas, and as many as 200 to 300 per hour over Asia," says Bill Cooke of the Meteoroid Environment Office at NASA's Marshall Space Flight Center. "Our forecast is in good accord with independent theoretical work by other astronomers."

Leonids are bits of debris from Comet Tempel-Tuttle. Every 33 years the comet visits the inner solar system and leaves a stream of dusty debris in its wake. Many of these streams have drifted across the November portion of Earth's orbit. Whenever our planet hits one, meteors appear to be flying out of the constellation Leo.

"We can predict when Earth will cross a debris stream with pretty good accuracy," says Cooke. "The intensity of the display is less certain, though, because we don't know how much debris is in each stream." Caveat observer!